
![]()
A MAP OF BINGHAM FOR 1586 (2)
Interpreting the survey document
A WEA class held over six weeks in 2001 attempted to convert the text for the freeholders, tenants and cottagers into a map.
This was its brief:
“There are two distinct parts to compiling a map from the survey (very similar to the 1776 survey) – firstly the layout of the houses and their plots in the town centre, and secondly the location and layout of the four open arable fields and their subdivisions the furlongs and then the strips. This is reflected in the content of the survey, which as you will see is effectively divided into two main sections – one listing the holdings by some 73 named tenants (which includes the descriptions of the dwellings and their boundaries) – and the other listing the strips by location within furlongs and fields.
“Re the town centre: it will be necessary to transcribe & translate the Latin descriptions of those 73 tenants’ dwellings.
“Re the fields: it will probably be impossible in most instances to reconstruct the position of the thousands of individual strips, but it will hopefully be possible to reconstruct the fields and furlong boundaries. This will largely be a tedious mathematical exercise, i.e. adding up the stated area of all the strips within each furlong in order to determine its total area, and then comparing this with the tithe map areas where the field names agree.”
A critical problem was the translation from the abbreviated Medieval Latin. Cards were produced to reproduce the boundary information in an attempt to locate adjacent holdings. A second problem was to arrange the resulting cards for each holding in the correct relative dispositions. A third problem was that there were too many people involved in trying to match the cards – the class likened it to the old card game of Happy Families! In practice it was a bit like attempting a jigsaw with no picture and no shape to the pieces. Drawing any resulting pattern onto a map of Bingham was beyond any manual process as although one could add up areas, one had no way of shaping boundaries to fit the grid iron town plan (assuming it was as now) and scaling the cards to match the areas. The latter would require a computer mapping programme (or Geographical Information System (GIS)), which we were fortunate in procuring for the field walking part of the current project. Using this software we were able iteratively to manipulate areas (‘polygons’ in the GIS jargon) to fit boundaries on the map whilst simultaneously maintaining the required area within acceptable accuracy.
The first step in the project to construct a map for 1586 was for one of our professional members to translate the Latin. The text based information was then entered into an Access data base. Four tables were designed for Basic Holdings (‘homesteads’) for freeholders, tenants and cottagers, additional holdings, where a person held a close or other piece of land which was described in the survey separately from their homestead, furlongs and holdings. 10 volunteers spent many hours transcribing into an Excel spreadsheet the details of each of the 4177 individual holdings in the open fields (sometimes themselves consisting of more than one ‘strip’). This involved establishing consistent spellings (the surveyor was not particular in this regard) as well as accurate copying! After checking, these were imported to the appropriate Access table. Appendix A contains detailed descriptions for each table and a facsimile of an example page from each section of the survey.
Throughout the survey, the surveyor used what seemed to have been a unique presentation of the figures for land areas. Four figures are given for each holding, be it homestead, close or holding in an open field. The area was presented for each of the portions of arable, meadow and pasture in the formation:
1 2
3 4
These units are (1) acres, (2) roods, (3) decs (Latin - decimae) and (4) perches. The term dec was unfamiliar to even the archivist on the project team! We eventually established that this was a tenth of a rood, there being no entry higher than 9 in the decs ‘column’ and none higher than 3 in the perches and test calculations matched the surveyors totals!
We subsequently traced this approach to a sixteenth century surveyor, Richard Benese (d 1546), who published a guide for surveyors. (Described in English Land Measuring to 1800, AW Richardson, Society for the History of Technology,1966) He used acres, roods, daywork and perches as the four units of area measurement. He produced pages of tables which were a ready reckoner by which one could read off the area (in these units) for any given length and breadth of a rectangle of land. Part of his table is reproduced at Figure 1.
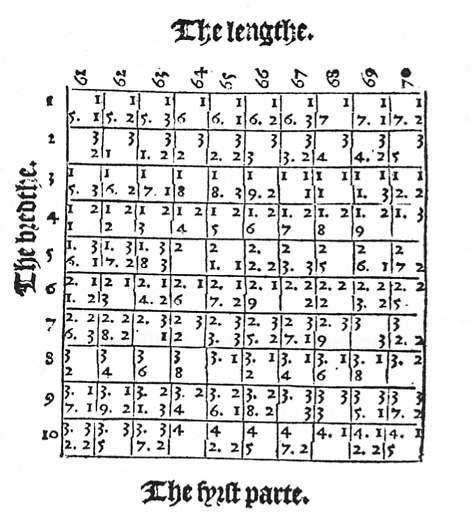
Figure 1: Benese’s table of areas
The survey was not accompanied by a map – or at least, one is not extant. Thus we have attempted to reconstruct such a map using the textual information and trying to marry it with the later maps at our disposal.
A number of maps are available:
- Current OS
- 1883 OS first edition
- 1841 Tithe map
- Sanderson’s ‘Twenty miles around Mansfield’ 1835
- Our reconstruction of the 1776 map
- Chapman’s map of Nottinghamshire 1774
- King’s map of Belvoir Vale 1806
- map and data for hedgerows of Bingham (BHTA)
- the1614 map of East Bridgford (Ashikaga, 1994)
- map of ridge and furrow (Coleman, S.R. 1979. Archaeology and landscape in the Vale of Belvoir. A survey Oct 1978-March 1979 (interim report). Trent Valley Archaeological Research Committee, University of Nottingham, Nottingham).
The 1883 maps were provided by the Ordnance Survey and digitally warped and registered to the modern OS by British Geological Survey. Nottinghamshire Archives loaned us a good copy of the 1841 tithe apportionment map which BGS kindly scanned, warped and registered. Other maps have been incorporated and warped by the Project Team. For presentational purposes and to enable modern-day residents easily to locate the historical features we tend to follow ‘modern’ field and road boundaries, except for features not present before 1850 such as the Bingham by-pass, the re-routed Chapel Lane, Station Street, rail lines etc. Because of registration alignment ‘inaccuracies’ on the GIS the same boundary on a succession of maps is usually not directly co-incident between layers. (map 1 illustrates the position) If an appropriate boundary is not present on the modern map, we stepped back in chronologically reverse order through the others to try to use recognised features to aid our placement of furlongs and other polygon features. Many tithe, and therefore ‘1776’, boundaries are straight lines clearly owing their origin to Enclosure. If the area required by the survey did not approximate within an acceptable tolerance to the area could achieve following boundaries, we would generally ignore one or more of these and make achieving the expected area the priority. Time consumed by polygon manipulation in the GIS constrained the accuracies we were able achieve – a polygon must be repeatedly modified to achieve a desired area and shape.
The survey reveals that in 1586 Bingham was largely organised into a village of homesteads, four open fields, several common meadows and moors but with a significant number of individually occupied closes either adjacent to the homestead or within an open field. Each tenant and some cottagers held holdings in each open field. Holdings were grouped, as was common practice, into furlongs of widely differing areas. Some holdings were owned by freeholders, some were occupied by the Demesne (i.e. worked directly on behalf of the Lord of the Manor) and some were allocated to the Glebe (Church).